
Meet the new Raw Logs page
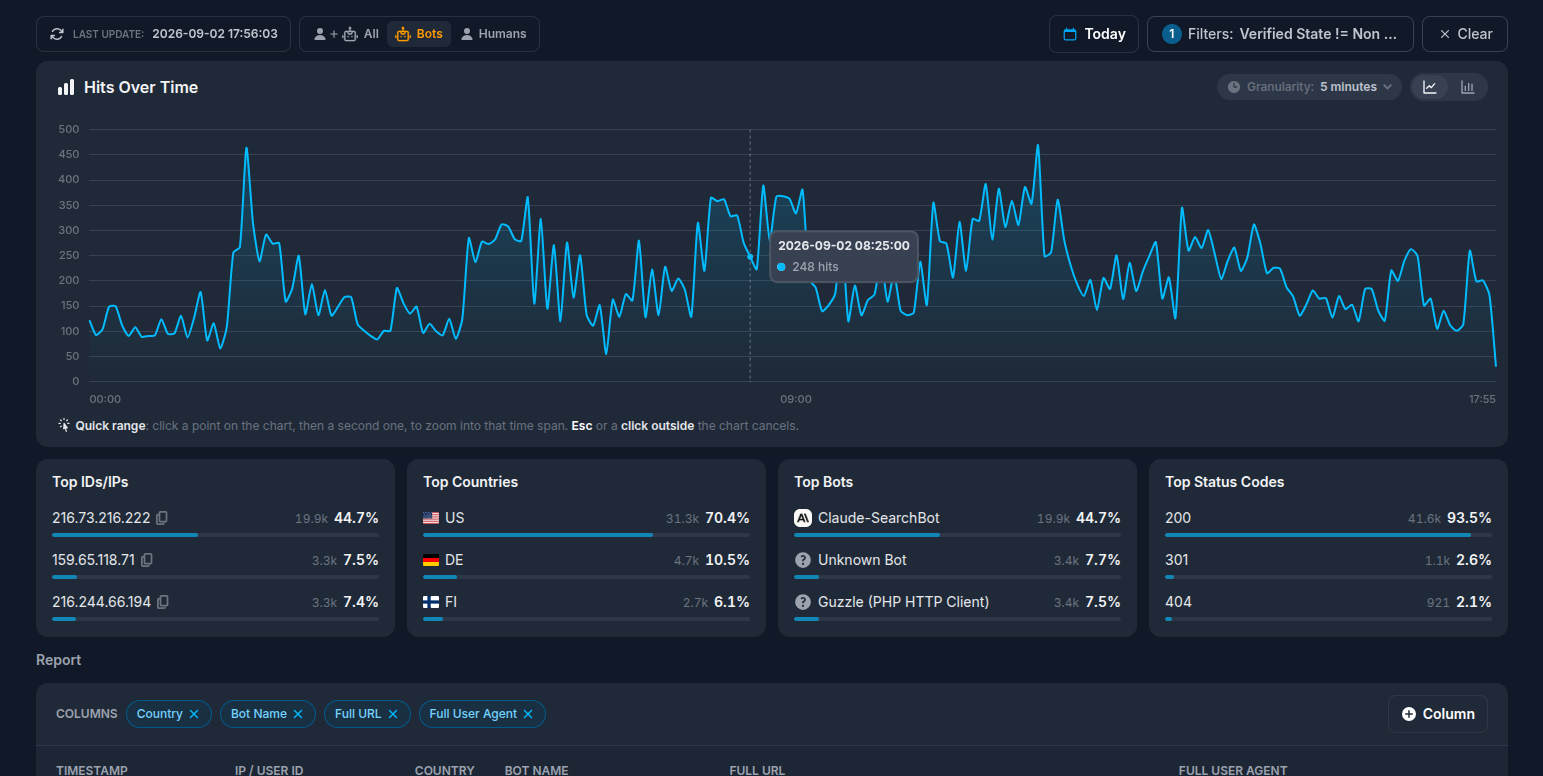
Spot a traffic spike, zoom into it and find out who caused it, all in a few clicks.
We rebuilt the Raw Logs page around one simple idea: when something strange happens in your traffic, you should be able to see it, isolate it and understand it in seconds. The page now opens with a chart of your hits over time, switchable between line and bar view, with granularity going all the way down to one minute. And here comes our favorite part: peak isolation. Spot a spike? Click once where it starts and once where it ends, and the whole page zooms into that exact window. The chart automatically refines to the finest granularity available, so a bump that looked like a single fat bar becomes a detailed minute by minute picture. Right below the chart you'll find four new panels: Top IDs/IPs, Top Countries, Top Bots and Top Status Codes. Each one shows the top values for the range you're looking at, together with their share of the total hits. So when traffic spikes, the answer is usually right there: a single IP hammering you, a bot gone wild, a wave of 404s. Every entry is clickable, and one click turns it into a filter. Filters are the glue that holds it all together. The query builder at the top lets you filter on any dimension of your events, and everything on the page reacts at once: chart, panels and table always tell the same story. Zoom into the spike, glance at the panels, click the suspect, and you're looking at exactly the requests that caused it.