
Using the Dashboard
Bot Conversions
See which AI and search platforms crawl your site and then send human visitors back to it.
Bot Conversions answers a simple question: when a platform like OpenAI, Google or Perplexity crawls your site, does it later send you real people? A "conversion" here is that chain. Their bots read your pages, then a human arrives from that platform's surfaces, for example ChatGPT, Gemini or Perplexity.
Honeylog groups bots by producer, the company that runs them, and shows the crawl volume next to the human visits attributed to that producer, in a single flow diagram.
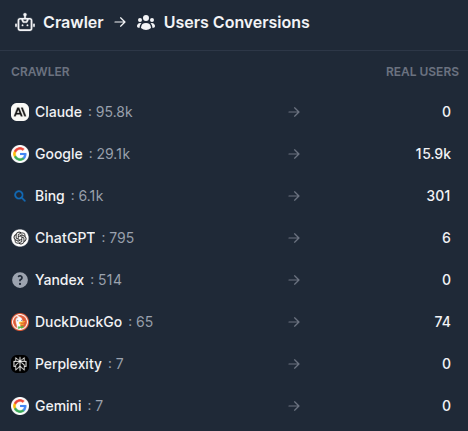
The feature has two pages, both under Bot Conversions in the sidebar, and both follow the date range chosen in the header date picker.
#Overview
The Overview shows one card per producer, sorted by crawl volume. Only producers with activity in the selected period appear.
Each card contains:
- The producer name and logo, with the total requests its bots made and, when attribution is available, the number of human visitors it sent.
- A flow diagram in three columns. The producer on the left, its individual bots in the middle with their category badge and request counts, and Human Visitors on the right. The thickness of each ribbon reflects the number of requests.
- A short note explaining how visits are attributed for that producer.
Clicking a producer opens its Producer Analysis. Clicking a bot opens All Requests filtered on that bot, so you can inspect exactly what it crawled. Producers with many bots collapse the tail into an "Other" node.
The lines from bots to Human Visitors are dotted on purpose. A referrer or a tagged link tells you the platform a visitor came from, not which specific crawler surfaced your page, so visits are attributed to the producer as a whole rather than to a single bot.
#Producer Analysis
This page focuses on one producer at a time. Pick it from the dropdown at the top; producers with visit attribution are listed first, and the selection is kept in the page address, so the view can be shared by link.
You get:
- The same flow diagram as the Overview, full width.
- A Converted paths table listing the pages that received attributed human visits. For each path you see the referred human visits, their share of all human visits on that path, and the split between visits from tagged links and visits detected by referrer.
The table is sortable by any numeric column and paginated at 10 rows. A search box lets you filter paths by host and pathname, which narrows both the diagram and the table.
If a producer has no known attribution sources, the page still shows its crawl activity and tells you that visits cannot be attributed for it.
#How attribution works
Human visits are matched to a producer with two signals, and each visit is only counted once:
- Tagged links. Some platforms append their own tag to outbound links, for example ChatGPT adds
utm_source=chatgpt.com. This is the most reliable signal and works even when the visit comes from a native app. - Referrer. When no tag is present, the visit's referrer is checked against the producer's known domains, such as
claude.aiorperplexity.ai. Native apps often strip the referrer, so this signal undercounts.
Because of the second point, treat the visit numbers as a floor rather than an exact figure. A platform can send you more people than what shows up here.
To study the crawl side in more depth, see Bot traffic and Visibility Radar.