
Using the Dashboard
Using the Honeylog dashboard
A tour of every page in your dashboard and what each one is for.
Once a website is connected, Honeylog turns its traffic into reports you can read. This guide explains every page in the dashboard, so you know where to look and what each screen does.
#Before you start
You need a website that is already sending data to Honeylog. If you have not connected one yet, start with Install Honeylog.
#How the dashboard is organised
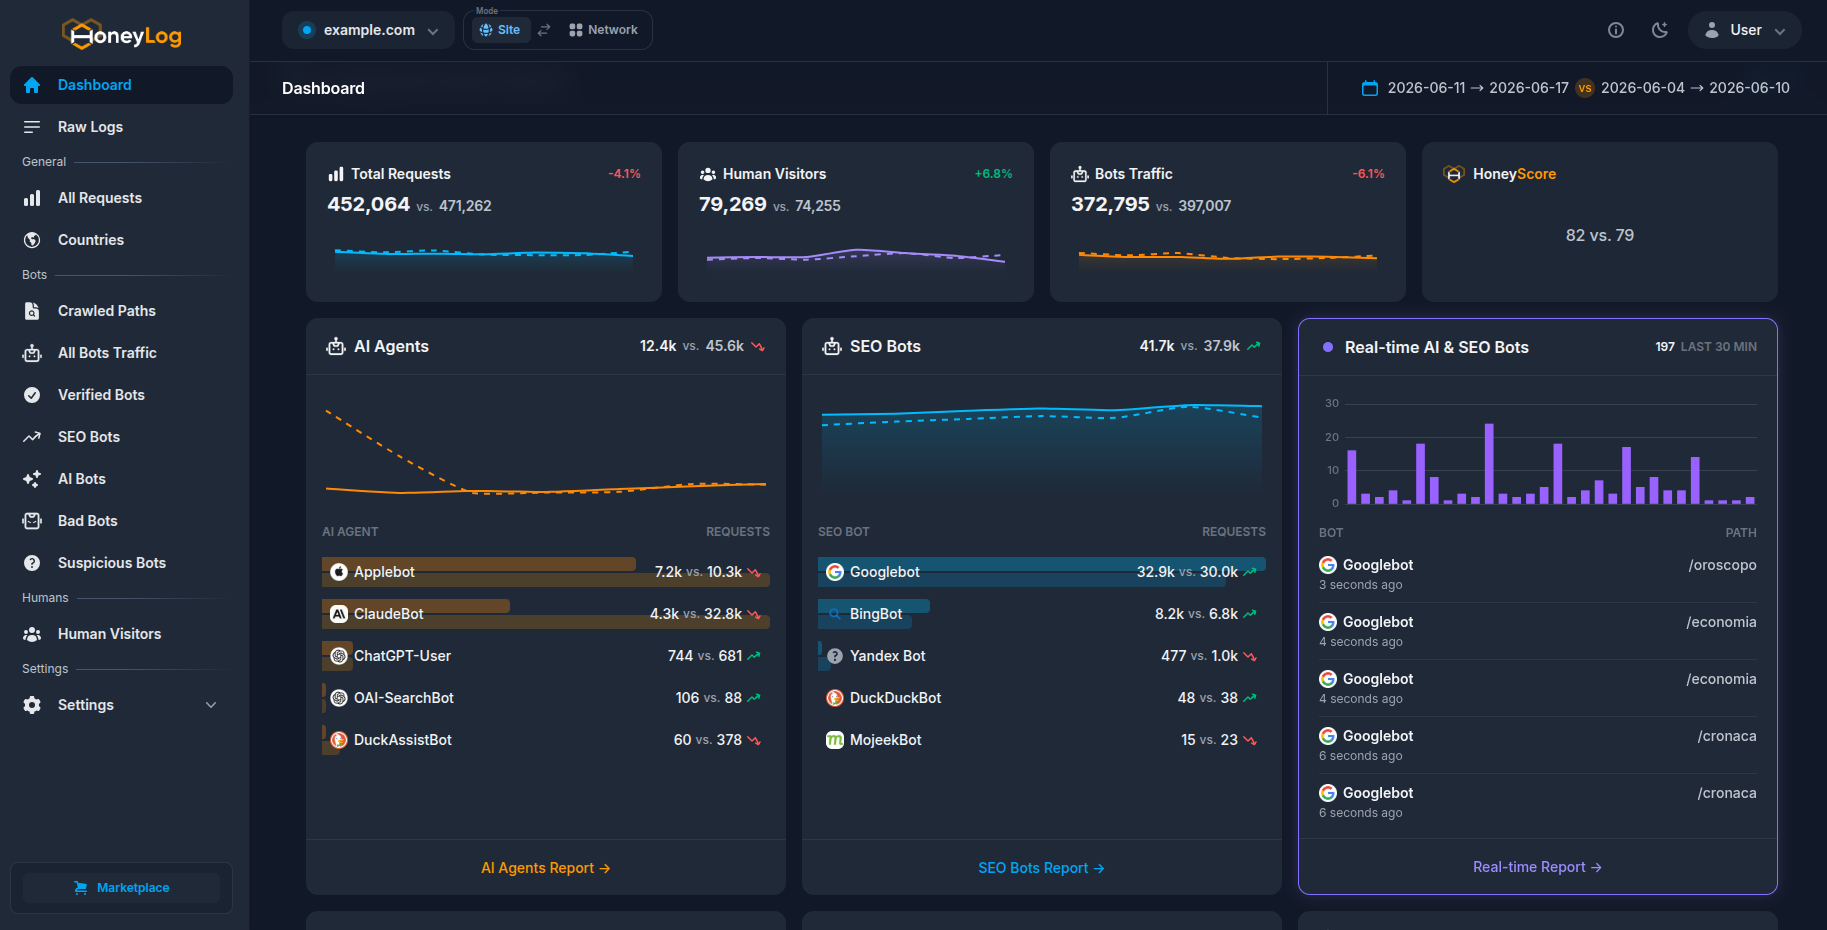
The left sidebar groups pages into three areas:
- Pages — your day-to-day analytics: the dashboard home, Visibility Radar, and Raw Logs.
- Reports — focused breakdowns of requests, bots, countries, and human visitors.
- Settings — site options and the installation guide for the current site.
At the top of every analytics page there is a date range picker and a resource switcher. The date picker controls the time window for the whole page. The switcher lets you move between a single site and a network of sites.
#The date range picker
The date picker sits in the bar below the main header and applies to every chart, table, and card on the page.
- Pick a quick preset (Today, Yesterday, Last 7 / 14 / 30 days, This month, and more) or set a custom start and end date.
- Optionally turn on a comparison period (previous period, previous month, previous year, or custom) to see change over time.
- Apply the selection. Every panel on the page reloads with the new range.
The default range is the last 7 days.
#Pages in this guide
Analytics:
- Dashboard home — the at-a-glance overview.
- Visibility Radar — which bots crawl you and how often.
- Raw Logs — the individual request log.
- Traffic reports — All Requests, Countries, and Human Visitors.
- Bot traffic — verified, SEO, AI, bad, and suspicious bots.
Account and team:
- Site settings — members, permissions, and installation.
- Plans & billing — plan, usage, invoices, and payment.
- Referrals — your referral link and stats.
- Networks & teams — group sites into a network.
- Account & preferences — date, number, and homepage settings.