
Using the Dashboard
Raw Logs
Inspect individual requests, one row per hit, with filters and extra columns.
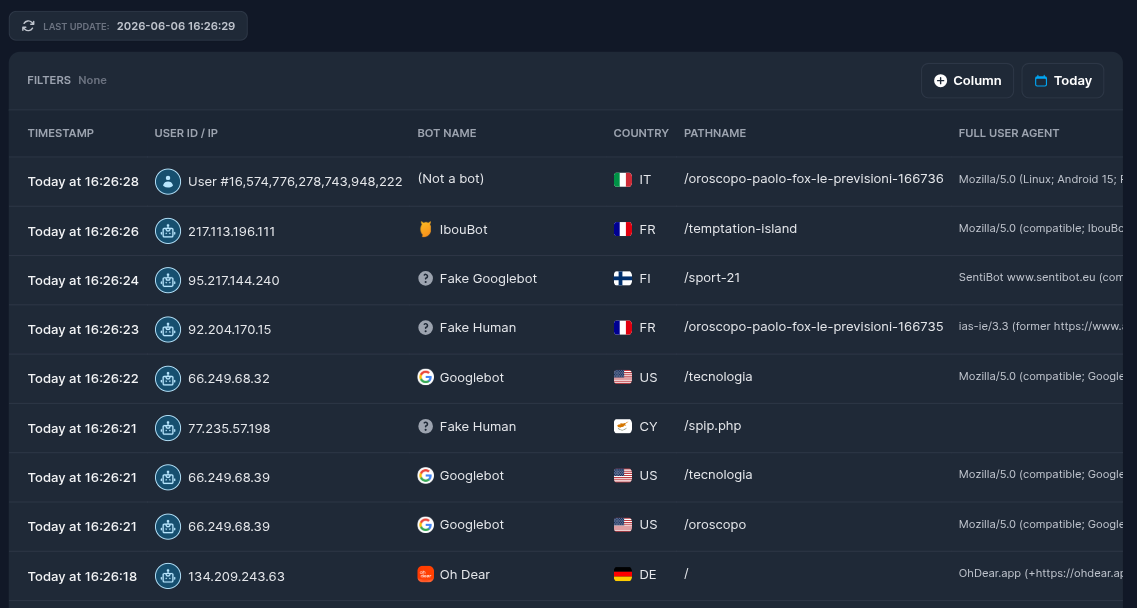
Raw Logs is the request-level view. Where the other pages aggregate traffic, this one shows individual requests, one row at a time. Use it to confirm a specific visit, debug an installation, or inspect a suspicious bot.
#The columns
Each row is a single request. These columns are always shown:
- Time — when the request happened, to the second.
- Visitor — the user id, IP address, or IPv6 address.
- Bot name — empty when the request is not a bot.
- Country — the two-letter country code.
- Path — the requested path.
- User agent — the full user-agent string.
You can switch on extra columns when you need more detail:
- Status code — the HTTP response (2xx, 4xx, 5xx, ...).
- Method — GET, POST, and so on.
- Response time — in milliseconds.
- Bytes sent — the response size.
#Choosing the time range
Raw Logs has its own time controls:
- Use a quick preset — Today, Yesterday, or Last 7 Days.
- Or set a custom start and end date and time.
Because the log is detailed, you can query up to 7 days back from the current moment.
#Filtering
Add one or more filters to narrow the list. You can filter by visitor, bot name, IP or IPv6 address, user id, country code, path, or full user agent.
- Add a filter and enter a value.
- Add more filters to combine conditions.
- Clear all filters to start over.
Applying a filter returns you to the first page of results. The table is paginated; move through pages with the next and previous controls.
For trends and totals rather than individual rows, use the Traffic reports or the Dashboard home.