
Using the Dashboard
Dashboard home
The at-a-glance overview of human traffic, bots, and the pages they visit.
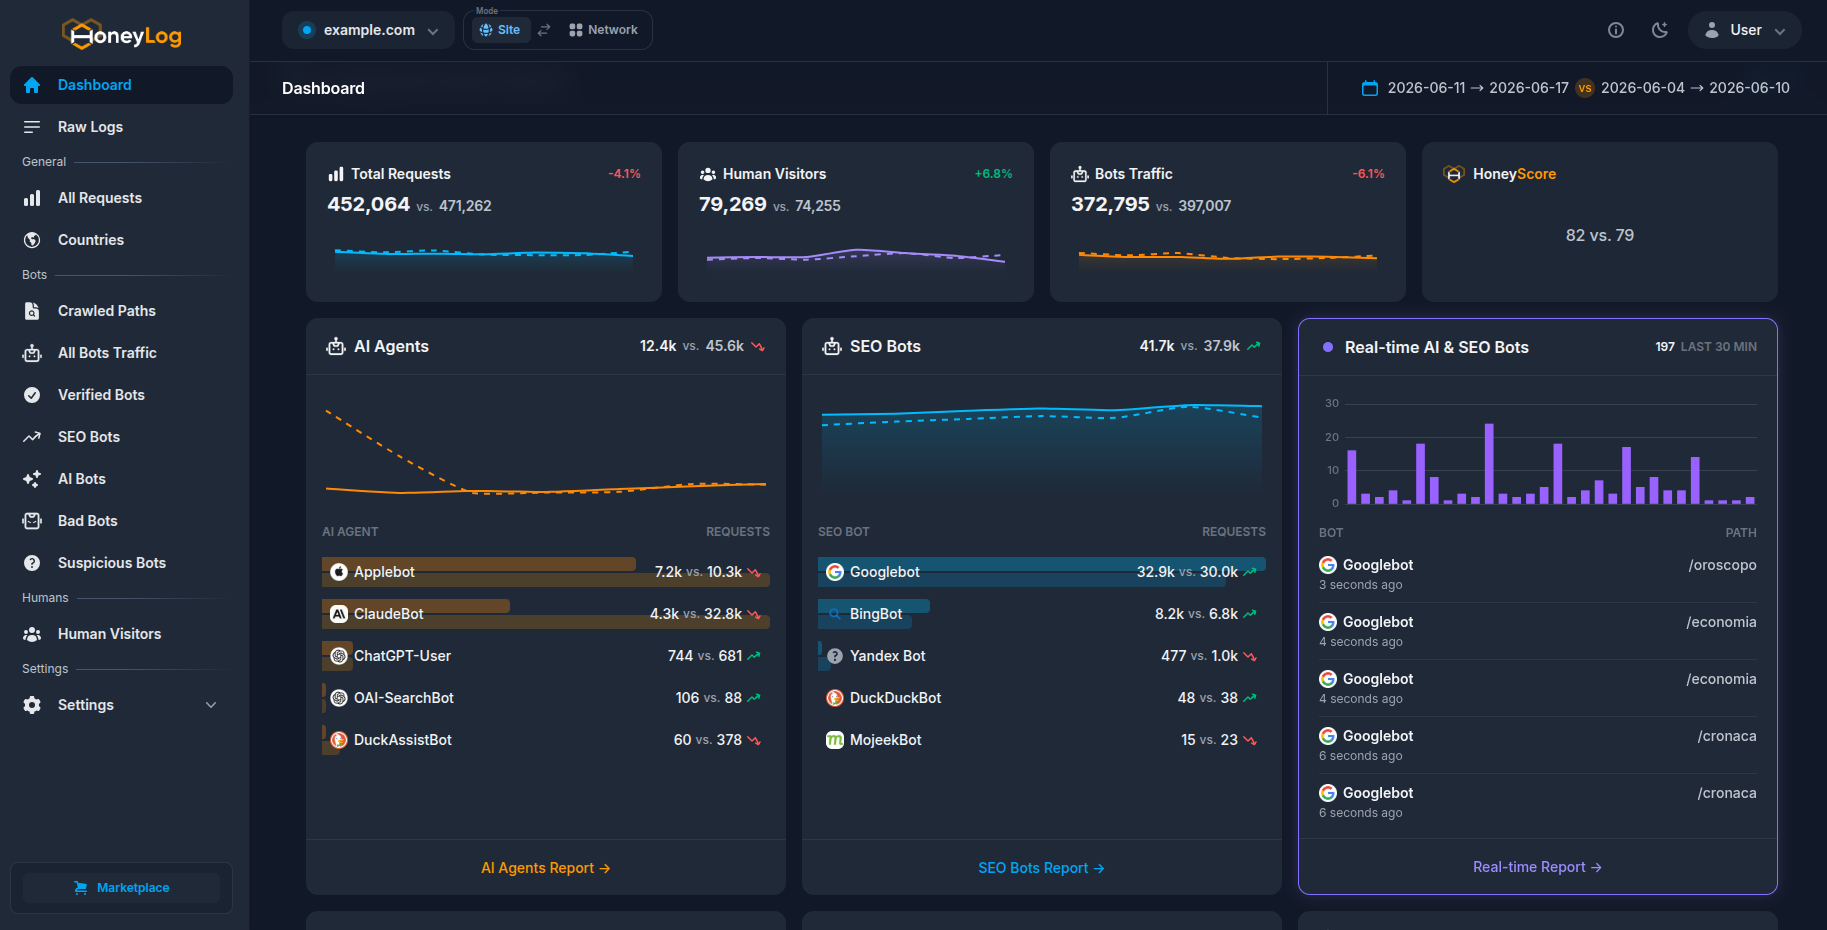
The dashboard home is the first page you see. It summarises the selected date range in a grid of cards, so you can read the state of a site in a few seconds.
#Reading the headline cards
The top cards give you the big numbers for the current range:
- Total Requests — every request Honeylog recorded. Open it to jump to the All Requests report.
- Human Visitors — requests from real people (traffic that is not a bot). Opens the Human Visitors report.
- Bot Traffic — every request that is a bot of any kind.
When a comparison period is active in the date picker, these cards also show the change against the previous period.
#Who is crawling you
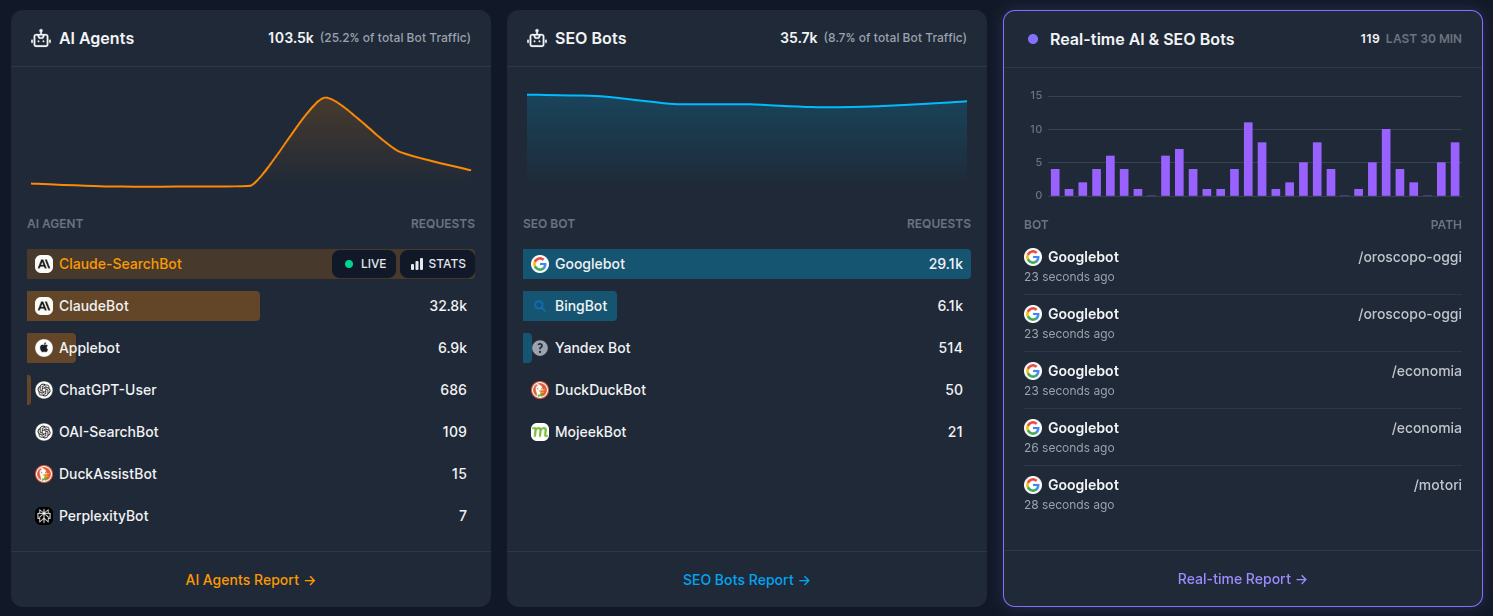
A set of lists shows the bots that touched the site:
- Top AI agents and Top SEO bots — the most active AI and SEO crawlers over the last 7 days, with a real-time view of recent activity.
- Malicious bots and Suspicious bots — bots flagged as confirmed-bad or not-yet-trusted.
To understand how a bot ends up in each list, see Bot traffic.
#How much traffic bots bring to my website
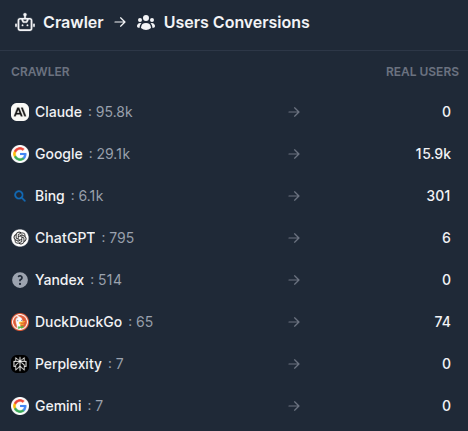
The Conversion Panel is fundamental to understand the traffic conversion. It gives a clear picture of how many visitors come from an AI or a SEO Bot.
#What they visit and where they come from
- Most crawled paths — the pages bots request most often.
- Top countries — where traffic comes from, by country.
#Changing the time window
Every card respects the date range picker at the top of the page. Change the range, or add a comparison period, and the whole dashboard updates at once.
For the request-level detail behind these numbers, open Raw Logs.